I’ve worked in maritime logistics for almost a decade, and I thought I’d seen it all — the pandemic port chaos, the Red Sea rerouting, the Ever Given memes. Then Hormuz happened, and everything I thought I understood about how freight rates move got rewritten in about six weeks.
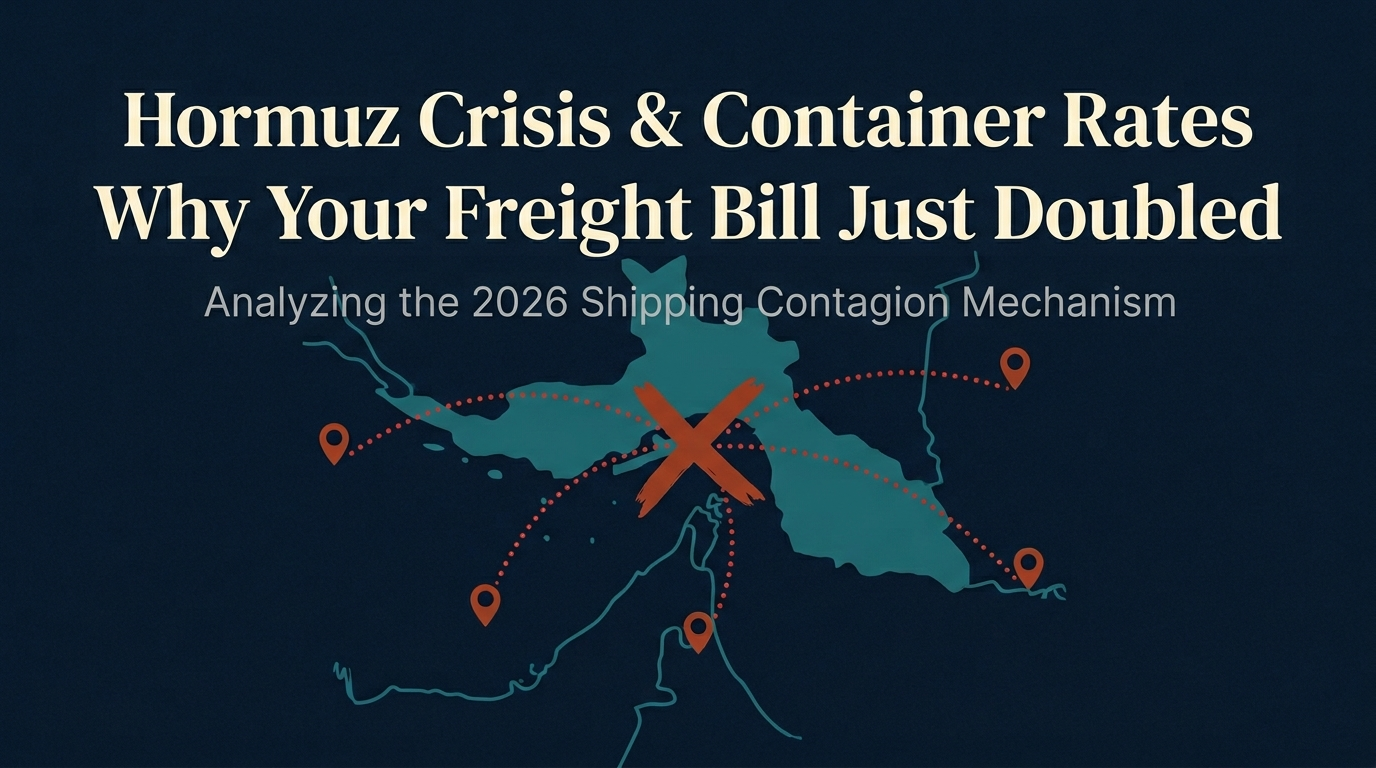
On February 28, 2026, U.S. and Israeli airstrikes against Iran triggered the effective closure of the Strait of Hormuz, one of the world’s most critical maritime chokepoints. Within days, Maersk, MSC, Hapag-Lloyd, and CMA CGM all suspended transits through the strait. What followed wasn’t just a regional disruption — it was a global rate contagion that proved, once again, that in shipping there is no such thing as “someone else’s problem.”
Six Weeks That Rewrote the Rate Book
Let me walk you through the timeline, because the speed of this crisis was genuinely unprecedented.
The Numbers: Container Rate Movements
Here’s what happened to the Shanghai Containerized Freight Index (SCFI) — seven consecutive weeks of increases through April 10, hitting 1,890.77 points:
| Trade Lane | Mid-Feb Rate | Apr 10 Rate | Change | Status |
|---|---|---|---|---|
| Middle East (Shanghai–Dubai) | $980/TEU | $4,167/TEU | +325% | ALL-TIME HIGH |
| US East Coast (Shanghai–New York) | $2,620/FEU | $3,518/FEU | +34% | SURGING |
| US West Coast (Shanghai–LA) | $1,880/FEU | $2,552/FEU | +29% | ELEVATED |
| North Europe (Shanghai–Rotterdam) | $1,290/TEU | $1,547/TEU | +20% | ELEVATED |
| Atlantic (Rotterdam–New York) | $1,574/FEU | $1,968/FEU | +25% | ELEVATED |
| Air Freight (emergency modal shift) | — | — | +20–47% | CAPACITY CRUNCH |
Sources: SCFI/Haesa News, FreightWaves/Xeneta, gCaptain
The Middle East lane number — $4,167/TEU — is worth pausing on. That is higher than the peak of the COVID-era rate frenzy ($3,960). A war premium just exceeded a pandemic premium. That tells you something about where the market’s head is right now.
The Part Most People Miss: Why Did Rates Jump Everywhere?
This is the question I get asked most. “I ship Shanghai to LA. Why do I care about the Persian Gulf?” The answer comes down to three mechanisms that turn a regional crisis into a global one.
1. The Capacity Sponge Effect
When ships reroute around the Cape of Good Hope instead of using shorter Gulf–Suez routes, they’re at sea 10–14 extra days per voyage. That doesn’t sound dramatic until you do the math: according to the St. Louis Fed and J.P. Morgan, this effectively removes about 9% of global container capacity. Same ships, same cargo demand — but 9% fewer available slot-days. Every lane in the world feels that squeeze.
2. The Insurance Shock
This crisis turned shipping from a freight business into an insurance business overnight. War risk insurance premiums jumped from 0.1% of vessel value to 1–5% per transit. For a $100 million containership, that’s up to $5 million per voyage — just for insurance. Carriers don’t eat that cost. They spread it across their entire network through War Risk Surcharges (WRS) of up to $1,500/TEU on Gulf lanes and general rate increases everywhere else.
3. The Equipment Trap
Up to 470,000 TEUs of container capacity got physically trapped inside the Persian Gulf — stuck on vessels that can’t leave. Those empty boxes were supposed to circulate back to Asian export hubs for the next load. Instead, manufacturers in Shenzhen, Ho Chi Minh City, and Busan faced container shortages, cancelled bookings, and premium charges to secure equipment — on routes that are nowhere near the Gulf.
The Hidden Cost Stack: What Your Invoice Actually Looks Like
If you’re a shipper, your rate is just one line on the bill. Here’s the full stack of charges that have appeared or surged since late February:
| Charge Type | Pre-Crisis | Current | Notes |
|---|---|---|---|
| Base Ocean Freight | Varies | +20–325% | Lane-dependent; see rate table above |
| War Risk Surcharge (WRS) | $0 | $500–$1,500/TEU | Gulf-linked corridors; new line item |
| Emergency Bunker Surcharge | $0 | $100–$200/TEU | Maersk sought FMC waiver to skip 30-day notice |
| Bunker Fuel (VLSFO) | Baseline | +35–80% | Singapore hub; ~2x pre-crisis at peak |
| Container Premium | $0 | Varies | Equipment shortage surcharge at Asian origin ports |
| Schedule Reliability Penalty | ~70% on-time | <30% | Cascading delays = inventory carrying costs |
This Has Happened Before — Sort Of
Every time a chokepoint closes, people say “this is unprecedented.” And every time, it both is and isn’t — as the history of maritime chokepoint crises keeps reminding us.
| Crisis | Duration | Capacity Impact | Rate Spike (Global) | Key Spillover |
|---|---|---|---|---|
| Suez Closure 1967–75 | 8 years | Massive | Structural | Invented the VLCC supertanker; global trade fell $1.7B |
| Ever Given 2021 | 6 days | ~12% temp. | ~15–25% | US West Coast vessel bunching; Maersk lost $89M |
| Red Sea/Houthi 2023–24 | 18+ months | ~9% | ~120% | Transpacific rates up 70% despite zero Red Sea exposure |
| Hormuz 2026 | 6+ weeks (ongoing) | ~9–10% | ~120%+ (WCI) | Both Hormuz AND Red Sea closed simultaneously; energy + freight combined shock |
The pattern is clear: every chokepoint crisis bleeds into non-adjacent routes through the same three mechanisms — capacity absorption, cost pass-through, and equipment imbalance. But Hormuz 2026 has a qualifier that makes it qualitatively worse than previous events:
The Jebel Ali Factor
There’s one more dimension that gets underappreciated: the shutdown of Jebel Ali as a functioning hub.
Jebel Ali isn’t just “a port in Dubai.” It’s one of the world’s top transshipment nodes — the place where Asian cargo gets sorted and redirected toward East Africa, the Indian subcontinent, and the Mediterranean. When Jebel Ali went dark, every feeder network connected to it went dark too. Schedule reliability collapsed below 30%. Cargo that was supposed to transship through Dubai got stranded at origin ports or diverted to Omani alternatives like Sohar and Salalah — ports that don’t have the same capacity or connectivity.
The ripple effect is still unfolding. Even with a ceasefire, CNN reports that roughly 400 loaded tankers are waiting to exit the Gulf, but only about 100 empty ships are waiting to enter. The imbalance means it could take until July for flows to normalize — and that’s only if the ceasefire holds.
What I’m Watching From Here
I’ll be honest: I don’t know how this ends. Nobody does. The ceasefire is fragile, Iran is charging million-dollar tolls per vessel, and the U.S. has started mine-clearing operations that Iran calls a ceasefire breach. But here’s what I’m tracking as indicators:
Inbound vessel count at Hormuz. Right now it’s near zero. Until empty ships start flowing back into the Gulf, the equipment trap gets worse every day. This is the single best leading indicator of normalization.
Insurance market signals. When P&I clubs start offering coverage for Gulf transits again at non-prohibitive rates, that’s when carriers will seriously consider resuming service. We’re not there yet.
Carrier blank sailing announcements. As Xeneta’s Peter Sand noted, if rerouting and slow steaming aren’t enough to manage capacity, blank sailings are the next lever carriers will pull — and that means another leg up in rates.
Peak season timing. We’re six weeks from the traditional pre-peak booking window. If this isn’t resolved by then, shippers who haven’t locked in contract rates are going to be competing for spot capacity in a market where 9% of global slots have evaporated. That’s a scenario nobody wants.
I don’t usually end posts with advice — I’m not a consultant, I’m someone who watches rates for a living. But if you ship anything, anywhere, and you’ve been treating this as “a Middle East problem,” please look at that transpacific column again. +29%. Thousands of miles from the nearest Iranian missile. That’s the nature of a connected system. When one artery closes, the whole body feels it.
Stay safe out there.